New Year, New KPIs: How To Measure Campaign Success on Social in 2019
Social media is an amazing and valuable tool at our fingertips every day, helping businesses reach new audiences, engage in bigger conversations, increase revenue and drive overall ROI.
But, there are always so many unanswered questions. How do I invest my money? How do I know my campaigns are working? Am I reaching the right audiences? How is social media connected to my overall business goals and successes?
We hear you, and we’ve got you covered. The one true way to get started on answering these questions is by tracking the right social media KPIs or Key Performance Indicators. These metrics can help you measure and compare valuable results across your campaigns, beyond traditional vanity metrics.
Here are some essential KPIs to measure for campaign success in 2019:
Campaign 1: Brand Awareness
- Estimated Brand Recall Lift: An estimate of the number of people who may remember seeing your ads, if asked, within 2 days. This metric is only available in the Brand Awareness, Post Engagement and Video Views Objectives.
- Cost Per Brand Recall Lift: The average cost it took for one of the people above to remember seeing your ads. This is super important in determining ad success because, as cost changes, so do the results.
- Impressions: The number of times your ads were on screen. Important because frequency is key in brand recall and paths to customer actions.
- Reach: The number of people who saw your ads. Also evaluate in reference to the frequency metric.
Campaign 2: Web Traffic
- Total Link Clicks/Landing Page Views
- Link Clicks: The number of clicks on links within the ad that lead to destinations or experiences, on or off Facebook.
- Landing Page Views: The number of times a person clicked on an ad link and successfully loaded the destination webpage. To report on landing page views, you must have created a Facebook pixel.
- Cost Per Link Click/Landing Page View: The average cost it took to acquire one link click or landing page view from your ads. Helps compare success over varying budgets.
- Unique Link Clicks: The number of people who performed a link click. Does not count repeat clicks from same user.
Campaign 3: Engagement
- Total Post Engagements: The total number of actions that people take involving your ads, including reactions, comments, shares, etc.
- Cost Per Engagement: The average cost for each post engagement. Helps compare success month over month when budget spend may change.
Campaign 4: Lead Generation
- Total Leads: The total number of leads generated from an ad’s custom forms.
- Cost Per Lead: The average cost of form responses submitted after people clicked on an ad that includes an instant form.
Campaign 5: Conversions
- Total Conversions: Conversions are customer-completed actions, like purchases or adding to a cart on a website. Depending on your objective, these metrics could include conversions, website add to cart, website purchases, website leads, mobile app actions, mobile app installs and mobile app purchases. You can use Facebook’s standard events or build your own custom events.
- Cost Per Conversion: The average cost for each conversion.
Remember, KPIs can change depending on the social platform, campaign objective, budget amount, audience size and many other factors that can change as quickly as monthly. Note these changes in your reporting, if you can.
It’s never too late to start tracking your social media KPIs. Start with some baseline goals for 2019, and get moving! We’re here if you need anything.
Let's build a tribe together
Ideas, Ideas, Ideas
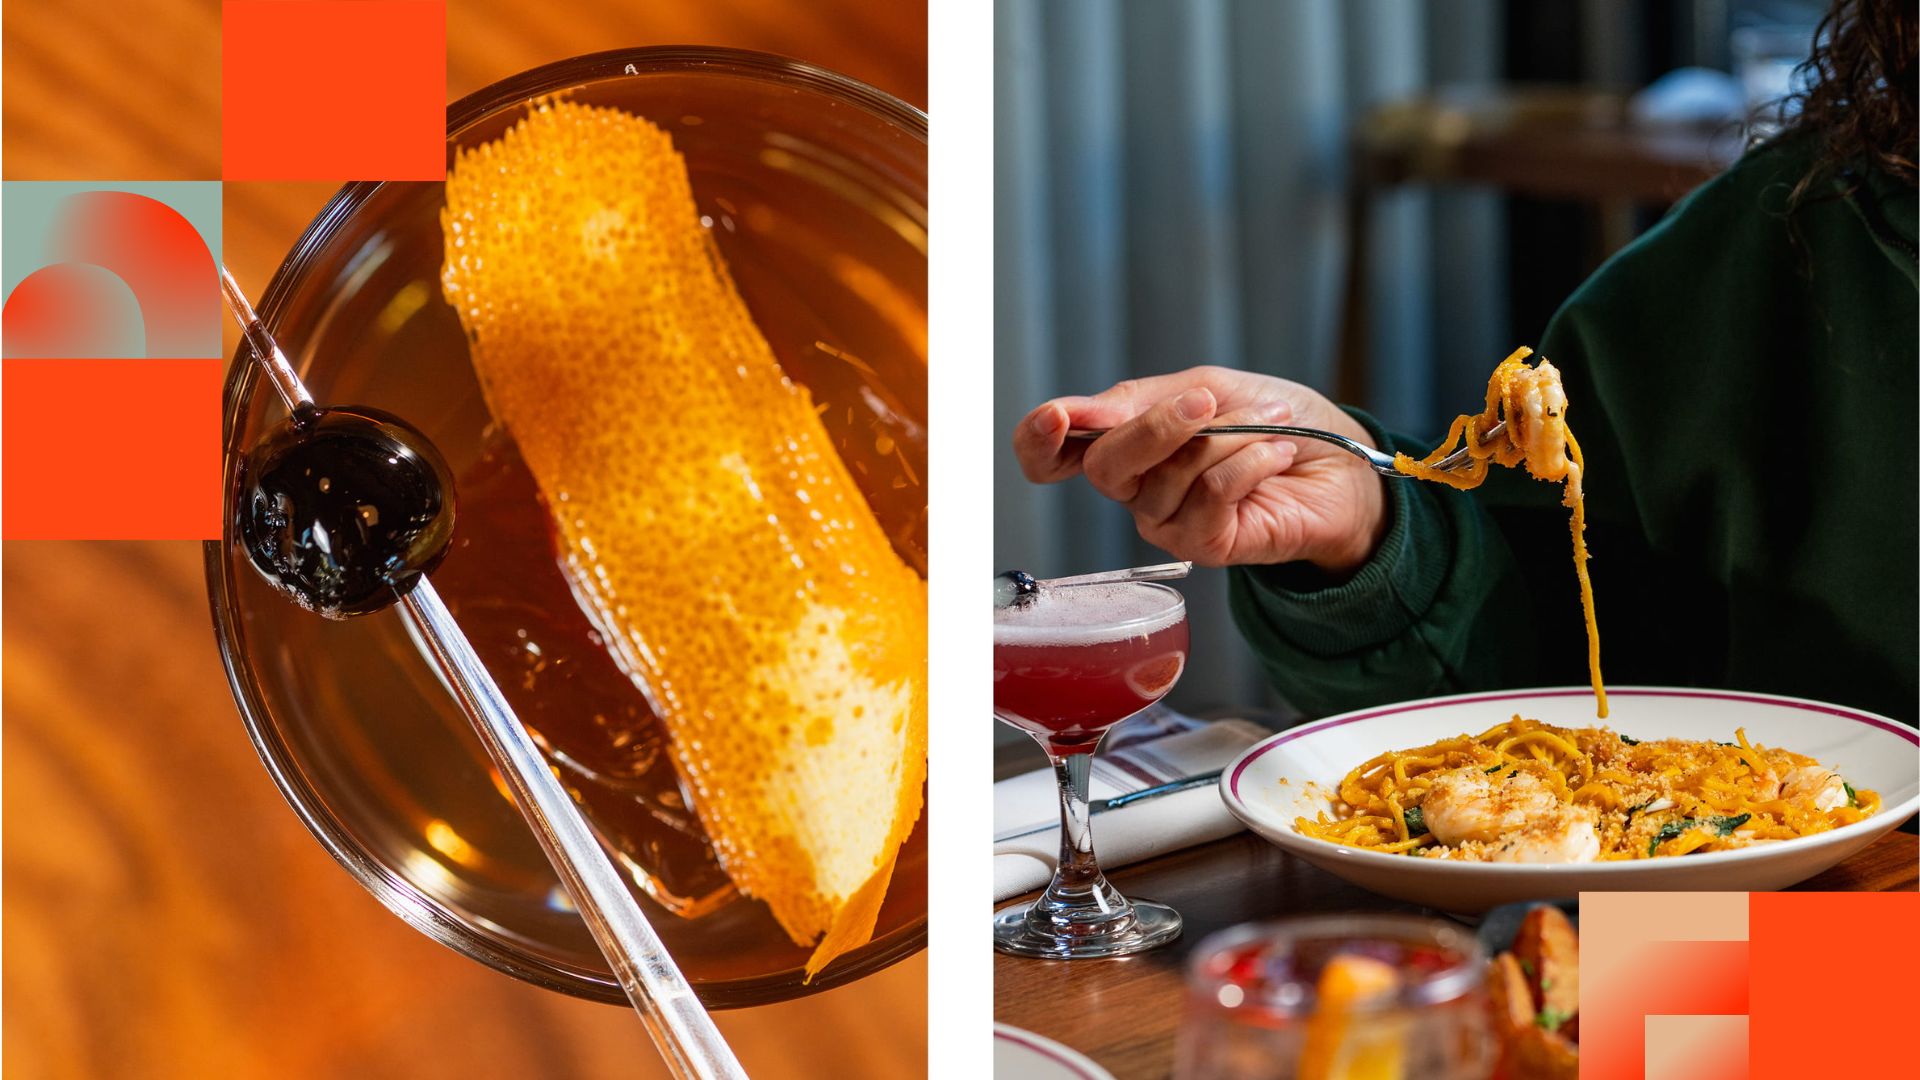
Before They Take a Bite, They Visit Your Feed
Discover how thoughtful restaurant content can help guests see the food, feel the experience, and decide to visit.
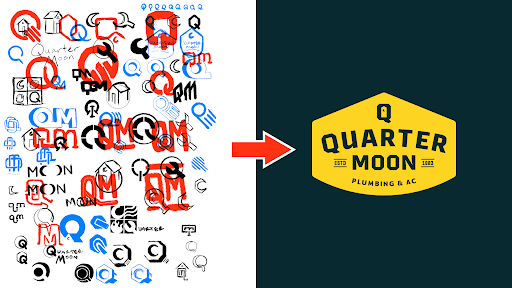
How to Build a Brand From Scratch
Learn the full process of building a brand, from logo sketches and research to website design and brand guide development.
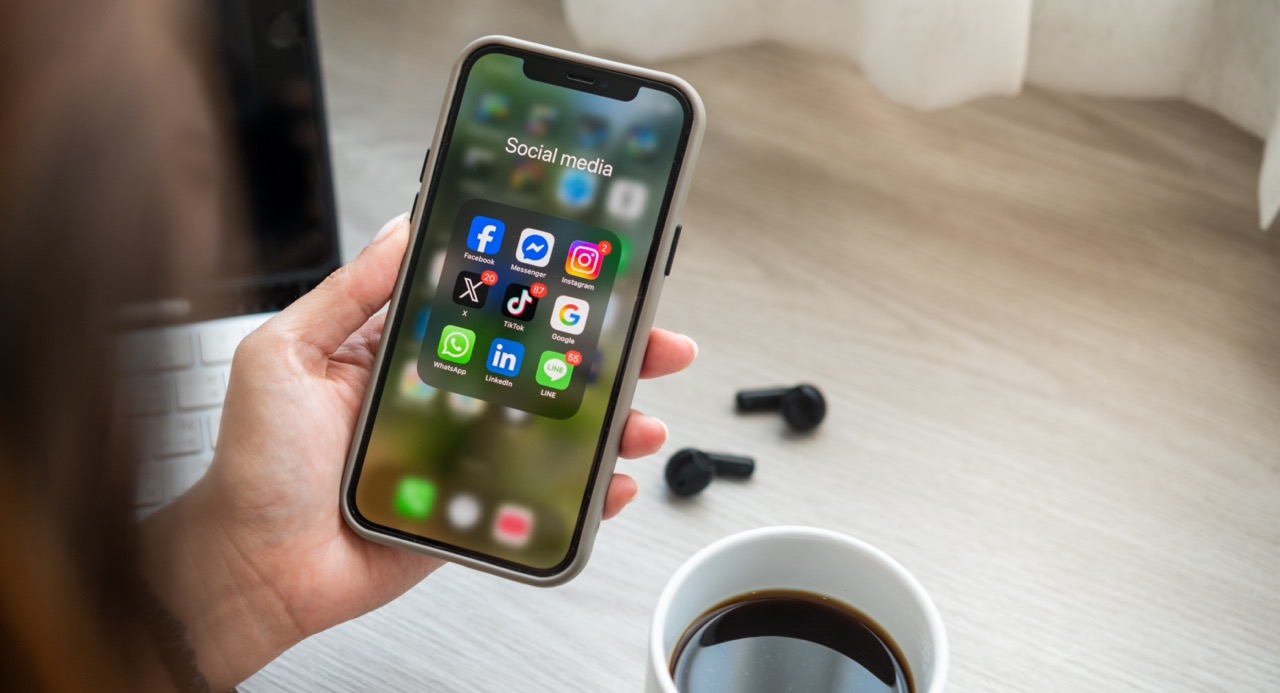
How Social Media Advertising Is Changing in 2026
Discover how brands can adapt to emerging social platforms with content that feels native, useful, and audience-aware.
Featured Work
We don’t just deliver - we make a difference.
Here’s a look at some of our most impactful branding, web, and campaign work. These aren’t just projects - they’re proof of what’s possible when bold ideas meet the right tribe.